Likes:
  Thanks:
  HaHa:
HaHa: 


Originally Posted by kercha83

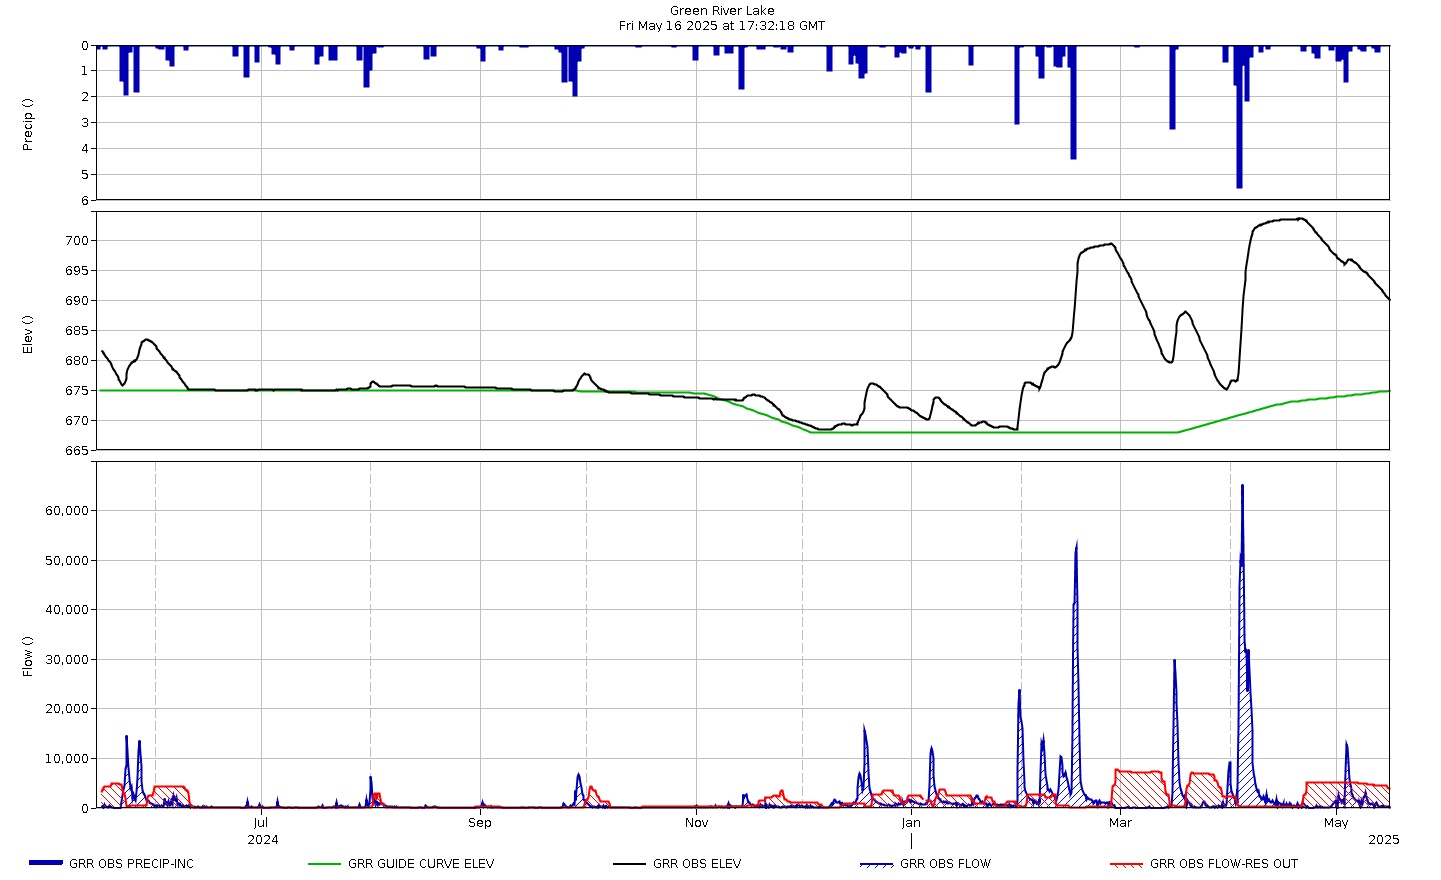
Just look at the dark blue lines at the top of the chart .... that's all the rain we've had. Then look at the bottom of the chart where the red lines are & compare them to the blue lines there : blue lines are how fast the water is coming into the lake, red lines are how fast they were letting water out of the lake (December especially). Like t.slabseeker said ... they were repairing the spillway & couldn't release the water !!

 Reply With Quote